Visualization Manual
For the visualization of CommonRoad, we use the visitor pattern. A visitor object, which we call renderer subsequently, has first to be instantiated. Afterward, the drawing function draw() of the IDrawable interface has to be called on all objects that should be visualized. All objects of the scenario and planning problems implement this function and can be individually drawn. Finally when all objects were drawn, render() is called on the renderer to show the objects. Currently, matplotlib is the only supported rendering engine in CommonRoad. It is implemented in the MPRenderer-class.
Creating plots in CommonRoad
The drawing function is used in combination with matplotlib. Therefore, the visualization of CommonRoad objects can be combined with standard matplotlib drawing functions. A simple example for plotting scenario and the corresponding planning problem set with default parameters would be:
from commonroad.common.file_reader import CommonRoadFileReader
from commonroad.visualization.mp_renderer import MPRenderer
filename = 'path/to/scenario/USA_US101-2_1_T-1.xml'
scenario, planning_problem_set = CommonRoadFileReader(filename).open()

rnd = MPRenderer(figsize=(8,4.5))
scenario.draw(rnd)
planning_problem_set.draw(rnd)
rnd.render()
(Source code, png, hires.png, pdf)
Styling options
The plotting style of the visualization module is defined by a MPDrawParams object.
For every drawable object, it contains a corresponding parameter object.
The MPDrawParams object can be either
set as the default parameters in the constructor of
MPRenderer, orby setting parameters on a per-object basis, when calling individual
draw()functions. Note, that the ladder overrides the former.
Example
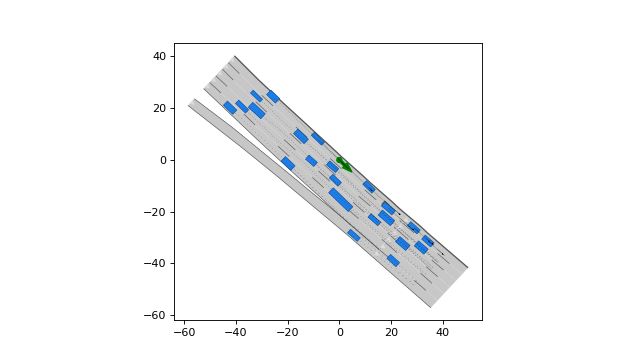
We want to draw dynamic obstacles in a scenario with a green and individual dynamic obstacles in yellow. This can be achieved by modifying the following drawing parameters:
scenario, planning_problem_set = CommonRoadFileReader(filename).open()
rnd = MPRenderer(figsize=(8,4.5))
rnd.draw_params.dynamic_obstacle.vehicle_shape.occupancy.shape.facecolor = "yellow"
draw_params = DynamicObstacleParams()
draw_params.vehicle_shape.occupancy.shape.facecolor = "green"
scenario.draw(rnd)
scenario.dynamic_obstacles[0].draw(rnd, draw_params)
planning_problem_set.draw(rnd)
rnd.render()
(Source code, png, hires.png, pdf)

Note, that colors are specified as matplotlib colors.
plot_limits
The drawn area of a scenario can be clipped by providing axes limits with plot_limits=[x_min, x_max, y_min, y_max] to the renderer. In cases where performance matters, this option should be preferred over setting axes limits with pyplot.get_gca().set_xlim. The latter would only crop the shown area of the scenario after drawing the whole scenario.
Creating videos in CommonRoad
You can use MPRenderer to create a video of a scenario in mp4, gif, or avi format (see create_video()).
Example
We want to create a gif following the vehicle with ID 394 in the scenario. This can be achieved as follows:
from commonroad.visualization.mp_renderer import MPDrawParams

scenario, _ = CommonRoadFileReader(filename).open()
rnd = MPRenderer()
rnd.focus_obstacle_id = 394
draw_params = MPDrawParams()
draw_params.time_end = 25
draw_params.dynamic_obstacle.show_label = False
draw_params.dynamic_obstacle.draw_icon = True
draw_params.dynamic_obstacle.draw_shape = True
rnd.create_video([scenario], str(scenario.scenario_id) + ".gif", draw_params=draw_params)
